Jeff Landau, Business Challenges Consulting10.15.21
In Part 1 of High Performing teams – It is possible I discussed the Drexler/Sibbet Team Performance Model, and the questions and thoughts team members have at each stage of the 7 stages - Orientation, Trust Building, Goal Clarification, Commitment, Implementation, High Performance and Renewal. In part 2, I will demonstrate several Graphic Facilitation tool examples which can be used to answer the relevant questions.
But first, what is Graphic Facilitation? Graphic facilitation is the use of graphics such as diagrams, pictures, symbols, and writing to lead people toward a goal in meetings, seminars, workshops, and conferences.[1] The graphics are usually drawn by hand, by a person called a graphic facilitator who may create the graphics in real time during the event. It is important to realize that when you are working with a group, your team, you need to be thinking how you answer their questions and get them aligned on what the team is trying to achieve.
To do this, using a common template, that is, one template which is viewed and worked on by all is key. This can be done virtually or in-person. The Graphic Facilitator can also utilize pre-printed or digital templates which are available from many organizations such as the Grove [2], Gamestorming[3], XPlane[4], Mindtools[5], and others. No need to re-invent the wheel. The trick is to use the right tool for the right situation.
Three additional examples of Graphic Facilitation tools and when to use them
There are many examples of tools that can be used at the different stages of team development. To keep it simple, I have put together three graphical examples matching 3 different stages of the 7 stages in the Team Performance Model.
Orientation Stage (1) – Why am I here?
One tool you can use is called Group Portraits. The facilitator creates a graphic portrait of the people attending the meeting. In this portrait, there would be a seating chart and next to each person you could put what their hopes are for the project or their professional background. In addition, you can add an icebreaker question. This chart can be created live and is a great way to get to know new team members in an active way. This tool can be adapted to the culture you are working in. In the example picture here for a Mexican Project, I used the backdrop of Mexico city and on the horizon are the hopes for the project and in the bottom half of the poster there were prompts such as 'your favorite place to travel?' and 'why?'.

Goal Clarification Stage (3) – What are we doing?
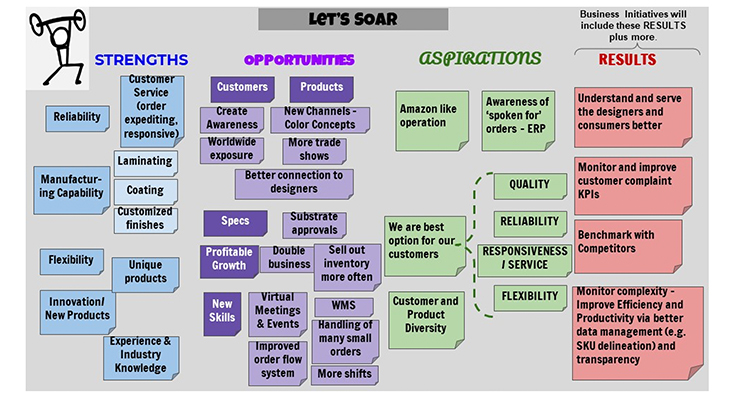
A relatively new tool I like to use is called SOAR which stands for Strengths, Opportunities, Aspirations and Results. You may be familiar with a similar tool called SWOT (Strengths, Weaknesses, Opportunities and Threats); it is also a useful tool. The SOAR analysis is a virtuous way to generate data about your team’s situation and provide a medium in which everyone can compare assumptions. SOAR analysis is a powerful tool to bring stakeholders together to recognize the potential of the organization and create a shared vision of the future. The example below was first created on a wall with paper and sticky notes. I created a digital version after the in-person workshop. The team the Results into Strategic Initiatives for the project team.
High Performance Stage (6) – Getting to WOW!
Teams that feel excited about working together, are spontaneous, tend to surpass results and are working in a synergistic way are in the WOW stage. One tool I routinely use in high performing teams who want to improve their meeting process is conducting a meeting evaluation. Typically, I use the acronyms WWW and OFI. What Went Well and Opportunities For Improvement. Here is feedback from a recent market growth project that I did with a group of six managers at a coatings/laminating manufacturer.

As one can see, the graphic tools focus on the task at hand, place on the project timeline and team maturation. Each project topic and group provides unlimited possibilities in marrying the right tool for the right situation. In our last installment of High Performing Teams – It is possible, I will explore the topic of Making Teams more Agile.
Footnotes
1. Agerbeck, Brandy (2012). The graphic facilitator's guide: how to use your listening, thinking & drawing skills to make meaning. Chicago: Loosetooth.com Library. ISBN 9780615591872. OCLC 794008185
2. The Grove https://grovetools-inc.com/
3. Gamestorming https://gamestorming.com/
4. XPlane https://xplane.com/worksheets/
5. Mindtools – Strategy Tools https://www.mindtools.com/pages/main/newMN_STR.htm
Bio
Jeff Landau is the founder and principal of Business Challenges Consulting. The company focuses on building better individual and team performance through executive coaching and strategic marketing projects. Jeff has been in the specialty chemical and ink & coatings businesses for 30-plus years. Jeff has held Marketing Management, Consulting and Training roles at Evonik Industries and prior to that worked in the Landau family business, Polytex Environmental Inks, where he had roles in Sales, Product Development (Ink Chemist) and Technical Service.
He can be reached at [email protected]; www.businesschallengesconsulting.us
But first, what is Graphic Facilitation? Graphic facilitation is the use of graphics such as diagrams, pictures, symbols, and writing to lead people toward a goal in meetings, seminars, workshops, and conferences.[1] The graphics are usually drawn by hand, by a person called a graphic facilitator who may create the graphics in real time during the event. It is important to realize that when you are working with a group, your team, you need to be thinking how you answer their questions and get them aligned on what the team is trying to achieve.
To do this, using a common template, that is, one template which is viewed and worked on by all is key. This can be done virtually or in-person. The Graphic Facilitator can also utilize pre-printed or digital templates which are available from many organizations such as the Grove [2], Gamestorming[3], XPlane[4], Mindtools[5], and others. No need to re-invent the wheel. The trick is to use the right tool for the right situation.
Three additional examples of Graphic Facilitation tools and when to use them
There are many examples of tools that can be used at the different stages of team development. To keep it simple, I have put together three graphical examples matching 3 different stages of the 7 stages in the Team Performance Model.
Orientation Stage (1) – Why am I here?
One tool you can use is called Group Portraits. The facilitator creates a graphic portrait of the people attending the meeting. In this portrait, there would be a seating chart and next to each person you could put what their hopes are for the project or their professional background. In addition, you can add an icebreaker question. This chart can be created live and is a great way to get to know new team members in an active way. This tool can be adapted to the culture you are working in. In the example picture here for a Mexican Project, I used the backdrop of Mexico city and on the horizon are the hopes for the project and in the bottom half of the poster there were prompts such as 'your favorite place to travel?' and 'why?'.
Goal Clarification Stage (3) – What are we doing?
A relatively new tool I like to use is called SOAR which stands for Strengths, Opportunities, Aspirations and Results. You may be familiar with a similar tool called SWOT (Strengths, Weaknesses, Opportunities and Threats); it is also a useful tool. The SOAR analysis is a virtuous way to generate data about your team’s situation and provide a medium in which everyone can compare assumptions. SOAR analysis is a powerful tool to bring stakeholders together to recognize the potential of the organization and create a shared vision of the future. The example below was first created on a wall with paper and sticky notes. I created a digital version after the in-person workshop. The team the Results into Strategic Initiatives for the project team.
High Performance Stage (6) – Getting to WOW!
Teams that feel excited about working together, are spontaneous, tend to surpass results and are working in a synergistic way are in the WOW stage. One tool I routinely use in high performing teams who want to improve their meeting process is conducting a meeting evaluation. Typically, I use the acronyms WWW and OFI. What Went Well and Opportunities For Improvement. Here is feedback from a recent market growth project that I did with a group of six managers at a coatings/laminating manufacturer.
As one can see, the graphic tools focus on the task at hand, place on the project timeline and team maturation. Each project topic and group provides unlimited possibilities in marrying the right tool for the right situation. In our last installment of High Performing Teams – It is possible, I will explore the topic of Making Teams more Agile.
Footnotes
1. Agerbeck, Brandy (2012). The graphic facilitator's guide: how to use your listening, thinking & drawing skills to make meaning. Chicago: Loosetooth.com Library. ISBN 9780615591872. OCLC 794008185
2. The Grove https://grovetools-inc.com/
3. Gamestorming https://gamestorming.com/
4. XPlane https://xplane.com/worksheets/
5. Mindtools – Strategy Tools https://www.mindtools.com/pages/main/newMN_STR.htm
Bio
Jeff Landau is the founder and principal of Business Challenges Consulting. The company focuses on building better individual and team performance through executive coaching and strategic marketing projects. Jeff has been in the specialty chemical and ink & coatings businesses for 30-plus years. Jeff has held Marketing Management, Consulting and Training roles at Evonik Industries and prior to that worked in the Landau family business, Polytex Environmental Inks, where he had roles in Sales, Product Development (Ink Chemist) and Technical Service.
He can be reached at [email protected]; www.businesschallengesconsulting.us
